How much do you know about the IES light distribution curve
How much do you know about the IES light distribution curve
Definition of light distribution curve:It refers to the light intensity distribution of light sources (or lamps) in all directions in space. On the metering plane passing through the center of the light source, the light intensity values of the lamps at different angles are measured. Starting from a certain direction, the light intensity of each angle is marked with a vector with the angle as a function, and the connection connecting the top of the vector is the polar coordinate light distribution curve of the lighting fixture. If the luminaire has a rotationally symmetric axis, only the light intensity distribution curve on a photometric surface passing through the axis can be used to illustrate the spatial distribution of its light intensity. If the light distribution of the luminaire in space is asymmetrical, it requires the light intensity distribution curves of several photometric planes can explain the spatial distribution of light intensity.
The two most common expressions of light distribution curve
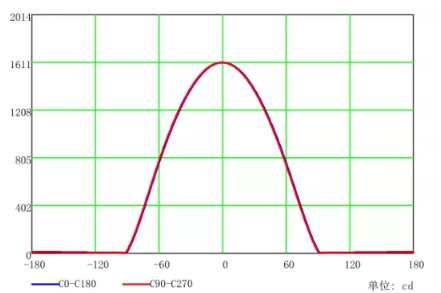
For condensing lamps, because the beam is concentrated in a very narrow solid angle, it is difficult to express the spatial distribution of its light intensity in polar coordinates, so the right-angle light distribution curve representation method is used, and the vertical axis represents the light intensity show as picture 1. Use the horizontal axis to indicate the projection angle of the beam. If it is a luminaire with a symmetrical axis of rotation, only one light distribution curve is needed to represent it, and if it is an asymmetrical luminaire, it needs multiple light distribution curves to represent it.
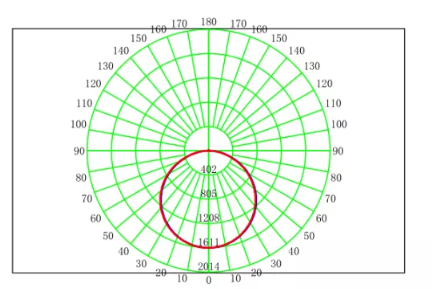
On the metering plane passing through the center of the light source, the light intensity values of the lamps at different angles are measured. Starting from a certain direction, the light intensity of each angle is marked with a vector with the angle as a function, and the connection connecting the top of the vector is the polar coordinate light distribution curve of the lighting fixture. If the luminaire has a rotationally symmetrical axis, only the light intensity distribution curve on a photometric surface passing through the axis can be used to illustrate the spatial distribution of its light intensity. If the light distribution of the luminaire in space is asymmetrical, it requires the light intensity distribution curves of several photometric planes can explain the spatial distribution of light intensity.
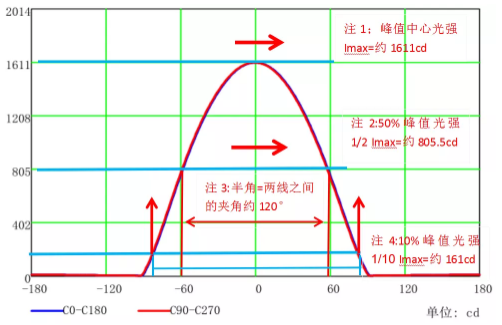
Note 1: (Peak center light intensity)
Peak light intensity: It can be seen from the figure that Imax=1611cd, and the magnitude of the peak light intensity determines the intensity and illuminance of the illumination. (Of course the factors that affect the illuminance and intensity are also related to the angle of the reflector and the irradiation distance)
Note 2: (50% peak light intensity)
50% peak light intensity: 1/2 Imax=805.5cd, here is mainly to see the beam angle.
Note 3: (Half angle)
Half-height angle: On the plane where the maximum light intensity is selected, the angle between two of 50% of the maximum light intensity is called the half-height angle. From the above figure, it can be seen that the sum of 60° on the left and right is approximately equal to 120°. The size of the beam angle determines the size of the spot, which is closely related to the illumination effect.
Note 4: (10% peak light intensity)
Effective beam angle: On the plane where the maximum light intensity is selected, the angle between two 10% of the maximum light intensity is called the effective beam angle of the plane. It can be seen from the figure above that the sum of about 80° on the left and right is approximately equal to 160°.
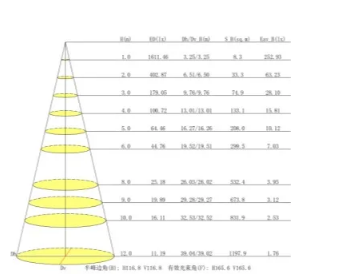
H: The illumination height of the lamp under test
E0: Center illuminance
DH/DV: The diameter of the horizontal axis and the vertical axis of the irradiation spot
S-B: The area of the irradiated area
EAV: The average illuminance of the illuminated area
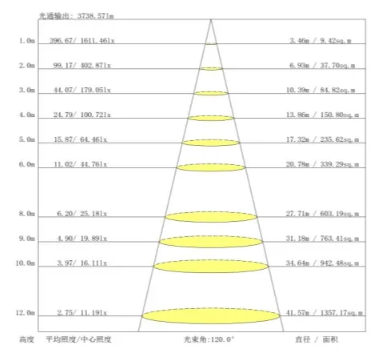
1: The luminous flux emitted by the lamp in the relative beam angle
2: The corresponding beam angle can be set in the system settings
3: The luminous flux output in the upper left corner of the above figure refers to the luminous flux within the beam angle.
Note: It is important to note that the luminous flux output in the above figure is not equal to the actual luminous flux of the lamp. The difference is that the luminous flux output lumens can be displayed in different angles according to the angle set in the system, and the luminous flux of the lamp is the actual instrument tested data.
Note: You do not need to make IES files yourself, Guangdong Moore Technology Co Ltd as a professional LED lighting manufacturers over than 10 years can provide IES files for all their LED lighting products, which are created in-house and made available for all customers.Contact our Sales Representative freely :info@mooreled.com
